Generate git graph locally without GIT!!!
August 10, 2020
| git |
What and Why ??
For one of the presentation that I was preparing I planned to show the development standards followed and the GIT strategy for the team. I could have created a repo and then make branches and do all kinds of GIT actions. Later when I push the changes to GitHub or Azure DevOps there I can find the git flow of branches commits tags etc. That is one way why not, take that image and stick it in a presentation or demo !!. But during a decision-design making process adding removing cleaning actions will knock it off the table, that will not work out that during a session and making new changes.
What the tools already available
Mermaid diagrams
If you have not already played around with mermaids then there it is… Mermaid info.
Now I can use Azure DevOps and create mermaids in WIKI
That does not support GIT mermaid unfortunately.
Using Script library
Since it should be generatable as a view, I choose to investigate if there were any HTML components or Python libraries and found out GitGraph fits best for my need.
Here are the steps:
- Install required platform:
NodeJS (Check if
nodeandnpmare accessible from terminal) - From terminal, download GitGraph into project folder - using this library we will create custom views in generating git graph
npm install @gitgraph/js -
Create HTML page and import module
<!DOCTYPE html> <html> <head> <script src="./node_modules/@gitgraph/js/lib/gitgraph.umd.js"></script> </head> </html> -
Add html body with content division so called
<div>tag after<head><body> <div id="my-git-graph"></div> </body> -
Within the html
<body>tag, create script that will fill the div containermy-git-graphthat is created in previous step<script> // Get the graph container HTML element. const graphContainer = document.getElementById("my-git-graph"); </script> -
Now, within the
<script>tag, start using the GitGraphJS module by first initializing with required optionsconst gitgraphOptions = { author: "Koushik Aravalli <koushik.aravalli@gmail.com>", // User your email orientation: "vertical", // other options: horizontal, vertical-reverse mode: "compact" // initail view hides commit messages (visible when hovering over) } // Instantiate the graph. const gitgraph = GitgraphJS.createGitgraph(graphContainer, gitgraphOptions); -
Ready to start with GIT actions within the
<script>tag-
Create branch
const a_new_branch = gitgraph.branch("a-new-branch"); -
Commit branch with message
a_new_branch.commit("Initial commit"); -
Also, add a tag a commit
a_new_branch.commit("Initial commit").tag("v0.1-alpha");
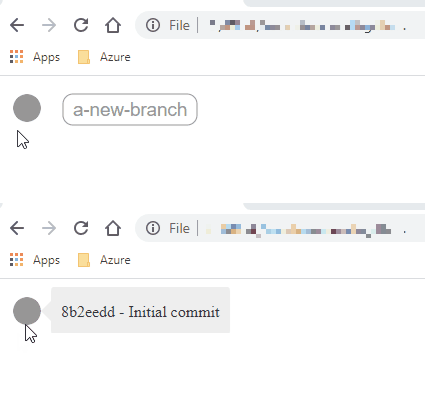
Here is the first branch

-
-
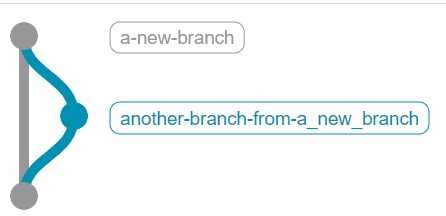
Now, we have a first branch, branch out from there with
a_new_branch.branch("another-branch-from-a_new_branch").commit("another branch first commit"); -
Finally, merge the
another-branch-from-a_new_branchintoa_new_branch// One-line a_new_branch.merge(a_new_branch.branch("another-branch-from-a_new_branch").commit("another branch first commit")); // Split it const another_new_branch = a_new_branch.branch("another-branch-from-a_new_branch").commit("another branch first commit"); a_new_branch.merge(another_new_branch);
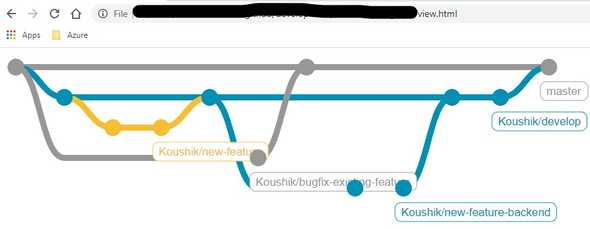
With more customizations it can be more illustrated
That is it.. I dint expect it would be this simple.. and here is the sample-gitgraph-code


